As one of our Ed Tech Classes was focused on Social Media use, I thought it would be cool to share the Social Media platform that I use to document my training – Garmin Connect! Now, I say social media because there is the option to make connections and connect with your contacts so others can see your daily training and vice versa. I have turned off this setting – I love Garmin Connect for the way it allows me to log my training and see all the statistics of my runs – but I don’t want that to be public to anyone else. This is mostly because I don’t want Garmin Connect to become a space in which I feel I have to run more, or run faster in order “to impress” my Garmin Connect Contacts, and I don’t want to see what others are documenting, compare their training with my own, and become discouraged. Either of those instances lead to a negative association with this social media platform, which I think is an otherwise wonderful resource, so I just turn off that setting to avoid that altogether! I think this goes back to the idea that Social Media isn’t a horrible resource; what matters is HOW you use it.
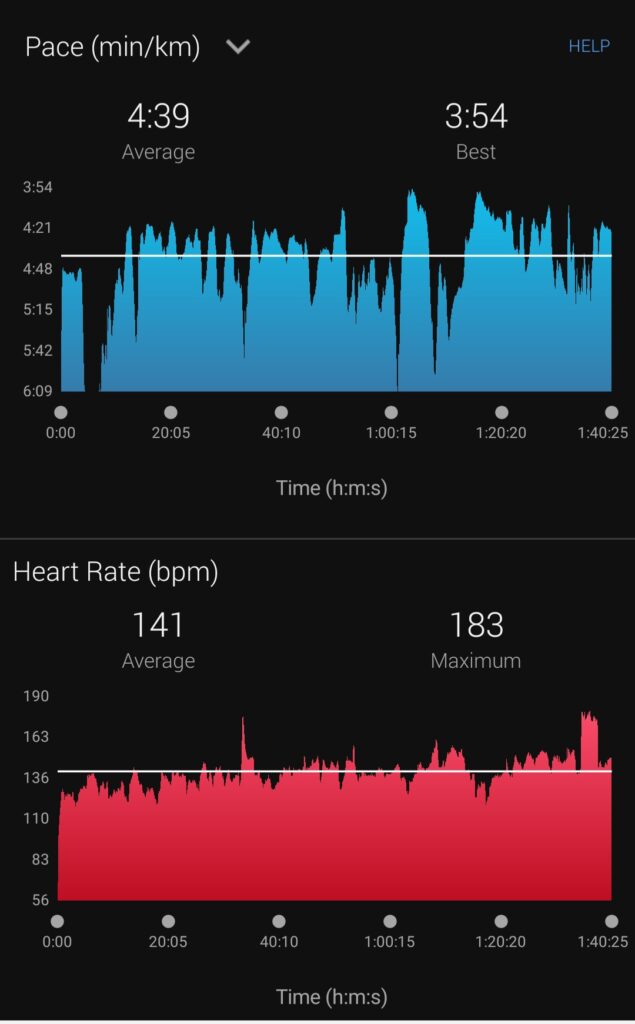
In Figure 1, we see graphical representations of my pace (how long it takes me to run a kilometer in minutes) and my heart rate (in beats per minute) throughout a ~100 minute run I completed a couple of weeks ago. As you can see from the graph, my pace fluctuates quite a bit throughout the run! This is mostly because the runs I do are very hilly (I slow down uphill, speed up on the flats and downhills), they are in and out of smooth roads and twisty, technical trails, and overall, I start my runs a bit slower than I finish them. In the second graph of the above image, we see the fluctuation of my heart rate throughout my run. Overall, it doesn’t change too much (a bit lower at the start than the end, which is to be expected), with the exception of a few “spikes” which are probably a result of the increased effort it took to run up some of the hills on this run! That being said, I often find the heart rate monitor is very inaccurate – likely due to the fact that it is built into my wristwatch – so for the most part, I ignore this information.
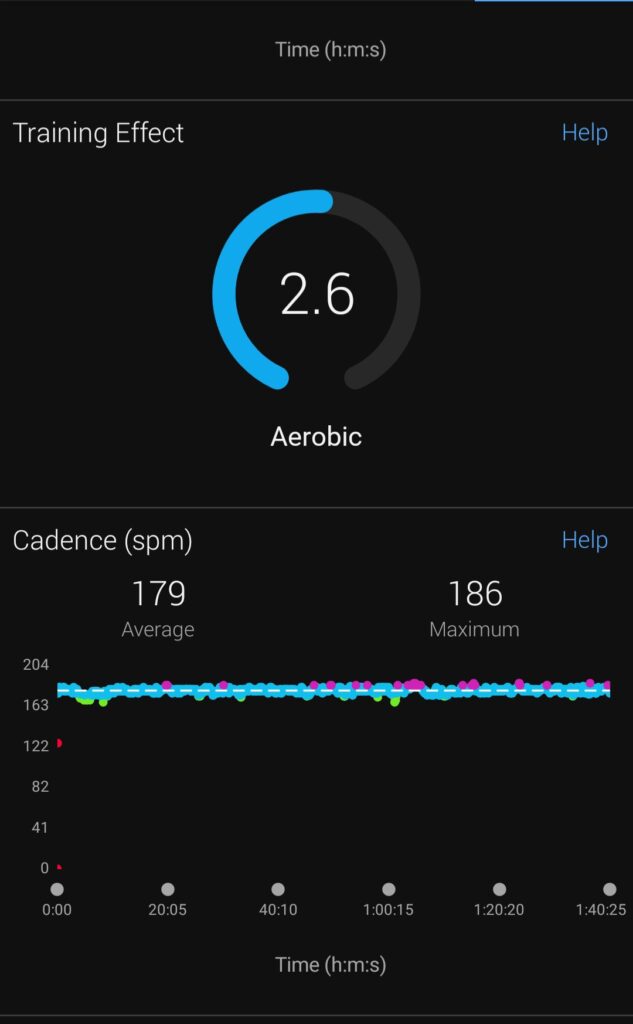
In Figure 2, we see “Training Effect” – an assigned numeric score based on the duration spent in specific training zones – this has to do with average heart rate. Both this number and the graph representing heart rate (see figure 1), are the 2 factors I typically neglect when I refer to the data on Garmin connect after a run as a result of the inaccurate heart rate monitor which influences this data. The second graph in figure 2 is the information that most interests me about my runs. Cadence is another way to say “stride frequency” or simply “number of steps per minute.” Typically, for an easy run, I want to be close to ~180 steps per minute (this run I averaged a cadence of 179 spm, so pretty good!). This is where I feel I am moving the most efficiently and ultimately reducing the risk of injury. On harder runs, my cadence is typically closer to ~185 to 190 spm.
Figure 3 shows an elevation profile (altitude in meters with respect to time throughout my run) in the first graph, and time in heart rate zones in the second diagram (once again, as this information is based on data collected from an inaccurate heart rate monitor, I don’t pay too much attention to this). I really like to look at the elevation profile of my runs. I think the hillier the run, the better because it adds variety to your run, trains different groups of muscles (whether going up, or down, or flat) and it fluctuates the effort level. A “varied” run provides more physical stimulus, making it more challenging, but it also makes it harder to “overdo it” reducing the risk of injury!
Evidently, there are some data points that this platform collects which are negligible do to the inaccuracies of the heart rate monitor, for example. However, that is not to say that Garmin Connect is not an excellent tool. To me, there is a lot of valuable information that Garmin gathers during a run and I love to be able to refer to this data on my Garmin Connect in order to see patterns in my training progress. For example, I’ve realized that I feel better AND run better when my cadence is good (~180 spm for easy runs) and this is often a positive correlation with an increase in fitness, speed, and consistency! These are patterns I like to see in my training, and it is awesome to have a tool to be able to record/reflect on this data!
Leave a Reply
You must be logged in to post a comment.